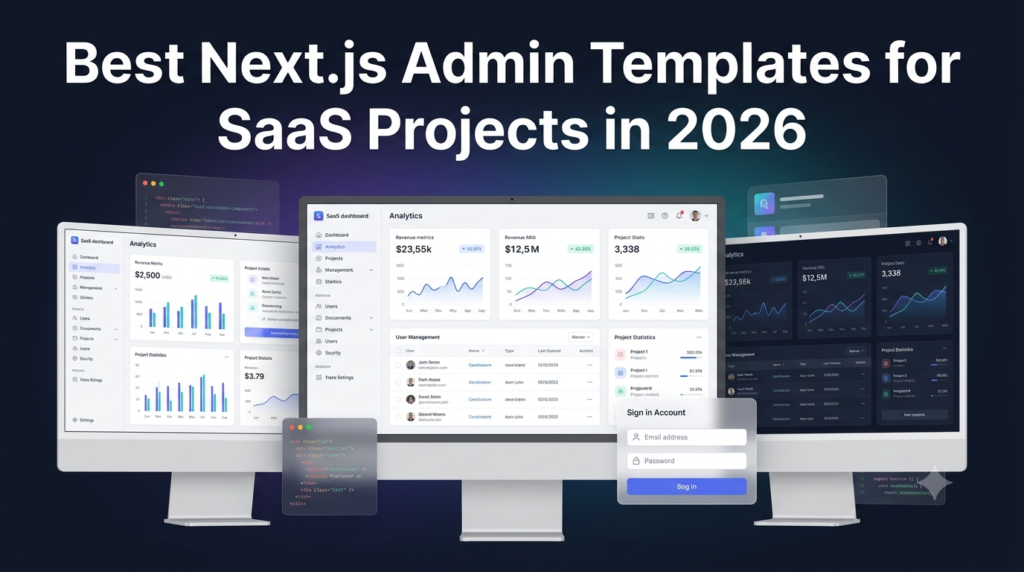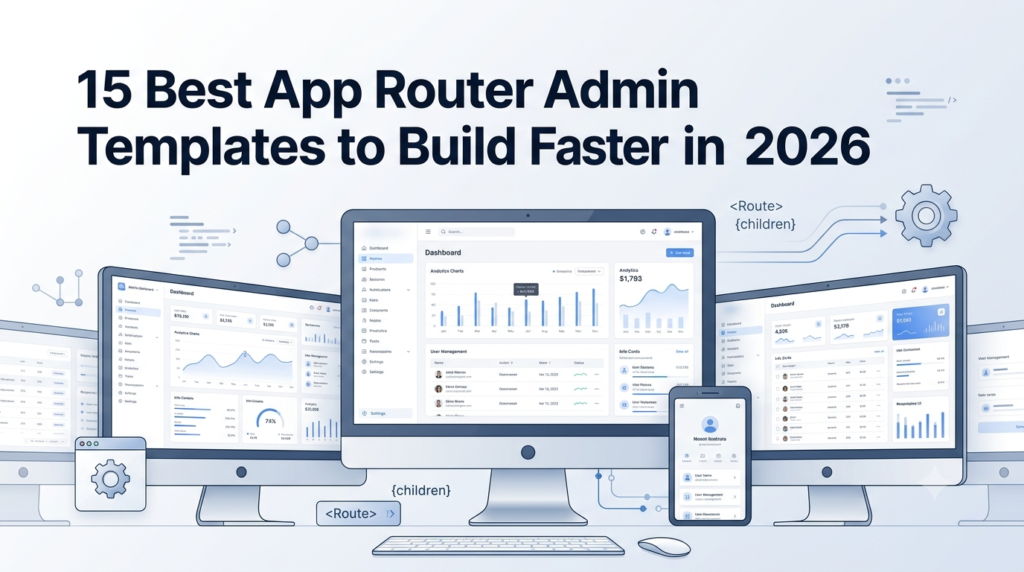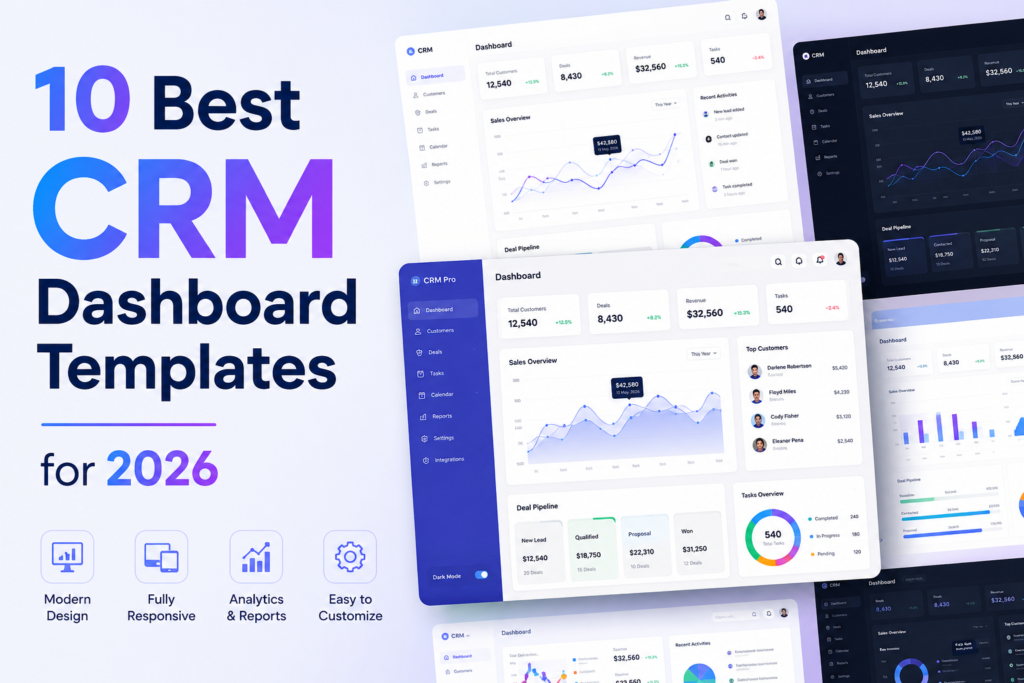




A dashboard is only useful when the data on it is easy to read. Most teams lose days wiring up charts, KPI cards, and data tables before a single number reaches the screen.
Analytics admin templates remove that setup work. They are pre-built admin dashboards focused on data display, with charts, KPI widgets, filterable tables, and reporting layouts already in place. You connect your data source and start tracking metrics the same day.
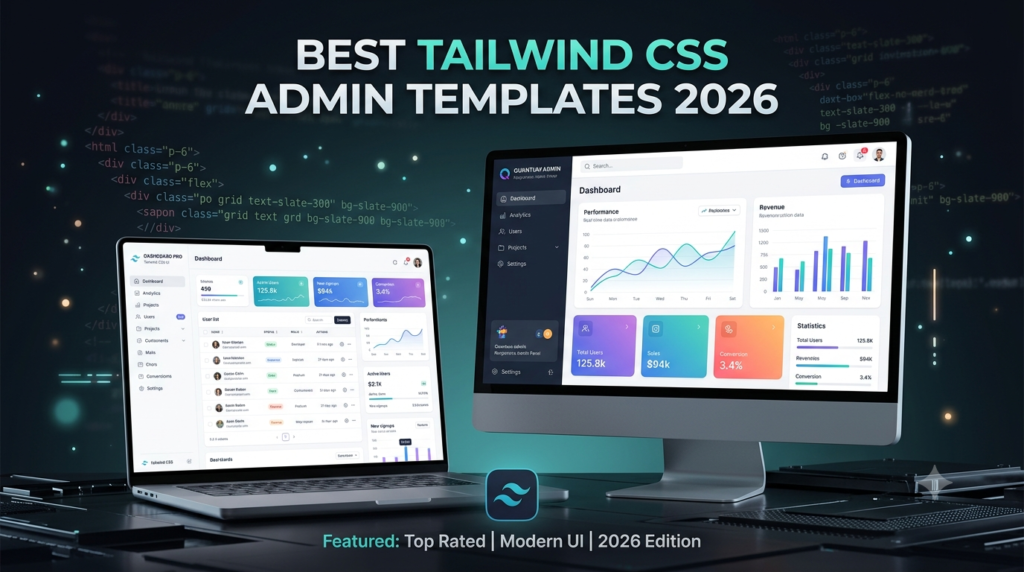
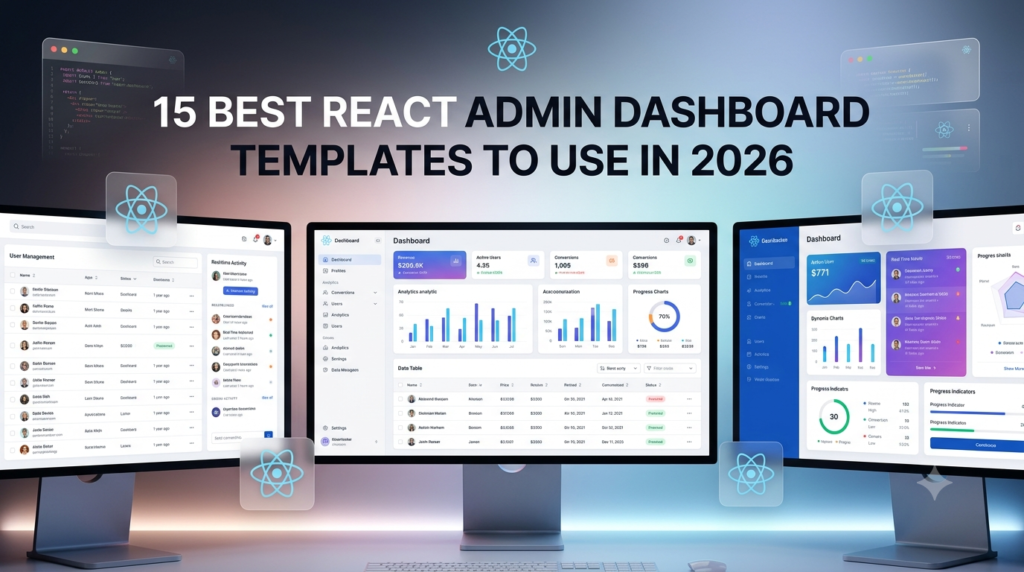
This guide reviews 15+ analytics admin templates for 2026 across Bootstrap, Tailwind, React, Next.js, Vue, and Angular. Every pick lists the framework, license, chart stack, and who it suits best, with live demos and download links. Some are free and MIT-licensed, others are premium with deeper feature sets.
Quick Picks: Best Analytics Admin Templates by Category
• Best overall (multi-framework): TailAdmin, 7 dashboards including a dedicated Analytics view, free plus pro (500+ components)
• Best free for chart range: Gentelella v4, Apache ECharts 6 with 20 chart types, 21,300+ stars
• Best Bootstrap analytics: Tabler, 200+ components and 40,000+ stars
• Best React analytics: Mantis, MUI v7 with an ApexCharts analytics dashboard, free plus pro
• Best enterprise and premium: Metronic, 9+ frameworks and 50+ demos including analytics layouts
Top 15+ Analytics Admin Templates at a Glance
| Template | Framework | Stars / Sales | License | Best For |
| TailAdmin | Tailwind (HTML/React/Next/Vue/Angular) | 2,000+ | Free + Pro | Multi-framework analytics |
| Gentelella v4 | Vite + Vanilla JS + ECharts 6 | 21,300+ | Free (MIT) | Chart-heavy dashboards |
| Tabler | Bootstrap 5.3 | 40,000+ | Free (MIT) | Polished Bootstrap analytics |
| AdminLTE 4 | Bootstrap 5.3 + TypeScript | 45,000+ | Free (MIT) | Proven, large community |
| CoreUI | Bootstrap / React / Vue / Angular | 12,000+ | Free + Pro | Same design across stacks |
| Mantis | React 19 + MUI v7 | 1,000+ | Free + Pro | Data-dense React dashboards |
| Berry | React + MUI | 2,000+ | Free + Pro | Client-facing React analytics |
| Shadcn Admin | React + Vite + Tailwind + shadcn/ui | 11,000+ | Free (MIT) | Own every component |
| Horizon UI | Chakra UI + React / Next.js | 4,000+ | Free + Pro | Clean Chakra analytics |
| Vuestic Admin | Vue 3 + Tailwind + Pinia | 11,000+ | Free (MIT) | Accessible Vue analytics |
| Flowbite Admin | Tailwind (HTML/React/Vue) | 2,800+ | Free (MIT) | Interactive Tailwind charts |
| Tremor | React + Tailwind (Recharts) | 3,300+ | Free (MIT) | Custom analytics UI |
| Windmill Dashboard | React + Tailwind | 2,000+ | Free (MIT) | Lightweight, accessible |
| Modernize | Next.js / React + MUI | Vendor | Free + Pro | Dense SaaS analytics |
| Materio | MUI / Vuetify / Bootstrap | Vendor | Free + Pro | Design-forward analytics |
| Metronic | 9+ frameworks (BS5/Tailwind/React/etc.) | 119,000+ | Premium | Enterprise analytics |
Note: star counts reflect each template’s main public repo and shift over time. Vendor templates (marked “Vendor”) often show low stars right after a framework migration despite years of development, so check the live demo and package versions before committing.
15+ Best Analytics Admin Templates (Full Reviews)
1. TailAdmin: Best Overall Analytics Admin Template
Framework: Tailwind CSS (HTML, React, Next.js, Vue, Angular, Laravel)
Stars: 2,000+ per repo
License: Free + Pro
Best for: One analytics design across several frameworks
TailAdmin ships seven dashboard variations, and one is a dedicated Analytics view with traffic, conversion, and revenue widgets. Charts run on ApexCharts, maps use JSVectorMap, and the same layout is available for React, Next.js, Vue, Angular, and plain HTML. The free tier covers 30+ components, while the pro tier expands to 500+ for larger data apps. For a Tailwind-first stack, it is the most complete analytics starting point on this list.
2. Gentelella v4: Best Free Template for Chart Variety
Framework: Vite 8 + Vanilla JS + Sass (Apache ECharts 6)
Stars: 21,300+
License: Free (MIT)
Best for: Self-hosted analytics without a JS framework
The May 2026 rewrite dropped Bootstrap and jQuery and moved to Vite with vanilla ES2022 JavaScript. For analytics, the standout is Apache ECharts 6 wired into 20 chart pages, including line, bar, scatter, heatmap, treemap, sunburst, and gauge, the same engine used inside many internal BI tools. Across 58 pages it ships an Analytics dashboard, DataTables for ranked exports, and Leaflet maps. A strong free pick when chart range matters more than a component framework.
3. Tabler: Best Bootstrap Analytics Template
Framework: Bootstrap 5.3 (HTML, React, Vue, Angular)
Stars: 40,000+
License: Free (MIT)
Best for: Polished Bootstrap dashboards that look paid
Tabler pairs a refined design system with 200+ components, 5,400+ SVG icons, and chart, data table, and world-map visualisations suited to reporting. Social analytics widgets, activity tracking, and KPI cards come ready to populate. With 40,000+ stars and no jQuery, it is the design benchmark among free Bootstrap dashboards, and a good fit for server-rendered apps on Laravel, Django, or Rails.
4. AdminLTE 4: Most Battle-Tested Analytics Admin
Framework: Bootstrap 5.5.3 + TypeScript
Stars: 45,000+
License: Free (MIT)
Best for: Proven panels with the largest community
AdminLTE has been the default admin dashboard for over a decade, and version 4 rebuilds it on Bootstrap 5.3 with pure TypeScript, no jQuery, dark mode, and RTL support. It ships 30+ pages with chart widgets, data tables, and dashboard variants you can connect to real metrics. With 45,000+ stars and 8.5M+ downloads, almost every integration question already has a Stack Overflow answer. Reliable when you want code that has been tested everywhere.
5. CoreUI: Best Multi-Framework Analytics Template
Framework: Bootstrap 5 / React / Vue / Angular
Stars: 12,000+
License: Free + Pro
Best for: Running the same dashboard across stacks
CoreUI delivers one analytics design that behaves the same in Bootstrap, React, Vue, and Angular, with native implementations rather than thin wrappers. The free tier includes responsive navigation, charts, data tables, and an extended widget library for KPI displays. Regular releases keep every variant current. A practical choice for agencies that build analytics dashboards on more than one framework.
6. Mantis: Best Free React Analytics Dashboard
Framework: React 19 + MUI v7 (Vite)
Stars: 1,000+
License: Free + Pro
Best for: Data-dense React dashboards on Material UI
Mantis blends Material UI components with Ant Design data patterns, which suits dense analytics screens. The dashboard ships income and loss tracking, area and bar charts on ApexCharts, recent order tables with status indicators, and transaction views. Built by CodedThemes (the Berry team), the free version covers seven core pages, and the pro version adds 85+. A clean React base when you want analytics structure out of the box.
7. Berry: Best-Looking Free React Analytics Dashboard
Framework: React + MUI + Redux Toolkit
Stars: 2,000+
License: Free + Pro
Best for: Client-facing analytics where design matters
Berry is the softer, more polished sibling to Mantis, also from CodedThemes. The free tier ships a complete dashboard with chart integrations, data tables, form components, and Redux Toolkit state management, enough to launch a real analytics product. The warm palette and spacing make it stand out in demos. A good pick when end users will see the dashboard.
8. Shadcn Admin: Best Modern shadcn/ui Analytics Base
Framework: React + Vite + Tailwind v4 + shadcn/ui
Stars: 11,000+
License: Free (MIT)
Best for: Teams that want to own every component
Shadcn Admin is the fastest-growing free React dashboard on GitHub. Because shadcn/ui components copy into your project instead of installing as a dependency, you own every line and no version bump breaks your UI. It ships dashboard pages, a collapsible sidebar, a Cmd+K command palette, light and dark mode, and RTL support. Pair it with Recharts or TanStack Table to build custom analytics views fast.
9. Horizon UI: Best Chakra UI Analytics Dashboard
Framework: Chakra UI + React / Next.js (Tailwind variant)
Stars: 4,000+
License: Free + Pro
Best for: Chakra teams building clean analytics panels
Horizon UI brings a bright, modern look to React and Next.js dashboards built on Chakra UI. The default analytics dashboard includes traffic widgets, charts, and data tables, with a Tailwind edition for teams that prefer utility classes. The free version is enough for a working analytics panel, and the pro tier adds more pages and components. A solid alternative when Material UI feels heavy.
10. Vuestic Admin: Best Vue 3 Analytics Dashboard
Framework: Vue 3 + Tailwind CSS + Pinia
Stars: 11,000+
License: Free (MIT)
Best for: Vue teams that care about accessibility
Maintained by Epicmax with professional release cycles, Vuestic Admin pairs Vue 3, Tailwind, and Pinia with 40+ components and a complete chart library. Data tables support server-side sorting, filtering, and pagination for real datasets, and accessibility is a first-class concern with proper ARIA labels. Among free Vue analytics templates, nothing matches this level of polish.
11. Flowbite Admin: Best Component-Rich Tailwind Analytics
Framework: Tailwind CSS (HTML, React, Vue)
Stars: 2,800+
License: Free (MIT)
Best for: Tailwind dashboards needing interactive charts
Flowbite Admin ships ApexCharts visualisations, sortable data tables, date pickers, CRUD pages, and auth flows across two dashboard layouts. Its component library handles dropdowns, modals, and tooltips in plain HTML, so you do not need React or Vue underneath. Backed by the wider Flowbite ecosystem, it is one of the most page-complete free Tailwind options for analytics work.
12. Tremor: Best for Building Custom Analytics UI
Framework: React + Tailwind CSS (built on Recharts)
Stars: 3,300+ (blocks repo)
License: Free (MIT)
Best for: Custom dashboards where data display is the whole job
Tremor is a React component library built only for analytics: area, bar, and donut charts, KPI cards, trackers, sparklines, and delta badges, all styled with Tailwind and ready for light and dark mode. You drop the components into your own layout instead of adopting a full admin shell. Note that the tremor.so site has had downtime, so use the GitHub repo for docs. The most focused option when visualisation is the priority.
13. Windmill Dashboard React: Best Lightweight Accessible Analytics
Framework: React + Tailwind CSS
Stars: 2,000+
License: Free (MIT)
Best for: Small, fast analytics dashboards with accessibility built in
Windmill is a lean Alpine.js + Tailwind CSS (HTML) dashboard with charts, tables, and a clean component set, designed with accessibility and dark mode in mind from the start. It stays small and easy to extend, which suits internal analytics tools and MVPs. A good base when you want speed and a tidy codebase over a large feature catalogue.
14. Modernize: Best for Dense SaaS Analytics Layouts
Framework: Next.js / React + MUI
Stars: Vendor repo, recently migrated
License: Free + Pro
Best for: SaaS teams building chart-heavy screens
Modernize, from AdminMart, is built for interactive analytics dashboards where chart density and UI consistency matter. Layouts favour overview reports, conversion tracking, and sales analytics, with React, Vite, and Material UI under the hood. The free version gives you a working dashboard, and the pro version expands pages and apps. The public repo is newer, so judge it by the live demo and package versions rather than star count.
15. Materio: Best Design-Forward Free and Pro Analytics
Framework: MUI (React/Next.js), Vuetify (Vue), Bootstrap
Stars: Vendor repo, recently migrated
License: Free + Pro
Best for: Premium-grade analytics design at no cost to start
Materio, from ThemeSelection, offers a clean, modern analytics dashboard with CRM and eCommerce variants across React, Next.js, Vue, and Bootstrap. The free tier ships a usable dashboard with charts and tables, and the pro tier adds many more pages and an extended component set. Design quality is the draw here. As with other vendor templates, check the demo and dependency versions before committing.
16. Metronic: Best Enterprise and Premium Analytics Template
Framework: Bootstrap 5 + Tailwind, React, Angular, Vue, Laravel, ASP.NET, Django and more
Sales: 119,000+
License: Premium
Best for: Large products that need every analytics layout prebuilt
Metronic is the world’s number one selling admin template, trusted by 120,000+ developers since 2013. It ships 50+ hand-crafted demos, including Finance Analytics, Website Analytics, Traffic Analytics, and Business Intelligence layouts, plus 1,000+ UI elements across nine-plus frameworks. For an enterprise analytics platform where you want the dashboard, CRM, and reporting screens already built and tested, it saves dozens of hours. Sold on ThemeForest with lifetime updates.
Best Free Analytics Admin Templates in 2026
If your budget is zero and the license needs to allow commercial use, these are the strongest free analytics picks from the full list.
• AdminLTE 4: most battle-tested, 45,000+ stars and a decade of production use
• Tabler: best design quality among free Bootstrap dashboards
• Gentelella v4: widest chart range with Apache ECharts 6
• Shadcn Admin: modern shadcn/ui base you fully own
• Vuestic Admin: best free Vue analytics dashboard with strong accessibility
For more no-cost options, browse the free admin templates collection.
Best Analytics Admin Templates by Framework
MyCreativeTemplates groups these by framework with live previews, so you can compare analytics dashboards side by side before downloading.
• React: Mantis, Berry, Shadcn Admin, and Horizon UI. See the full React admin templates range.
• Tailwind: TailAdmin, Flowbite Admin, and Tremor. Compare Tailwind admin templates.
• Bootstrap: Tabler, AdminLTE 4, and CoreUI. Browse Bootstrap admin templates.
• Vue: Vuestic Admin and Materio Vuetify. Explore Vue admin templates.
• Next.js: Shadcn Admin, Modernize, and Horizon UI. See Next.js admin templates.
• Angular: TailAdmin Angular, CoreUI Angular, and Metronic Angular. View Angular admin templates.
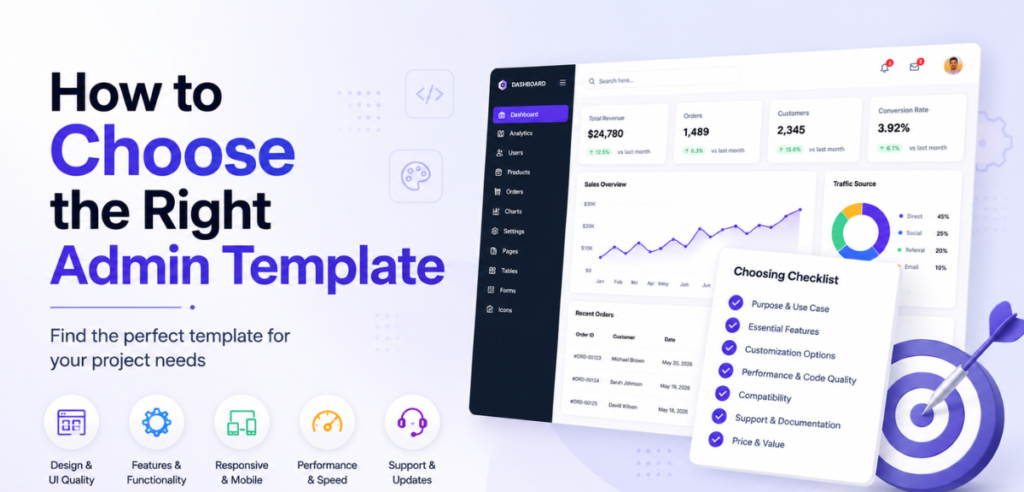
How to Choose the Right Analytics Dashboard Template
Run through this checklist before you download any analytics dashboard template.
• Match your framework. Use Bootstrap or Tailwind for server-rendered apps, and React, Next.js, Vue, or Angular for single-page apps.
• Check the chart library. ApexCharts, Chart.js, ECharts, and Recharts cover most needs. Confirm the chart types you require exist in the live demo.
• Test the data table. Open the demo and sort, filter, and paginate a large table. If it lags, your production data will too.
• Check the license. MIT and Apache 2.0 allow commercial use. Read the LICENSE file before shipping to a client.
• Check GitHub activity. A commit within the last 3 to 6 months and closed issues are healthy signs. Weigh the live demo too, since vendor templates can show low stars after a migration.
• Preview on mobile. Analytics dashboards break most often on small screens. Open the demo on your phone first.
Free vs Premium Analytics Templates: What You Give Up
Free analytics templates give you a complete dashboard layout, 5 to 30 pages, charts, KPI widgets, data tables, and auth screens, plus community support through GitHub and usually an MIT license.
Premium analytics templates add 50 to 150+ pages, multiple dashboard variants for finance, traffic, and SaaS, advanced features like real-time widgets and CRUD scaffolding, dedicated support, and guaranteed framework updates.
For an MVP or internal tool, a free analytics dashboard template is usually enough. For a client deliverable or a SaaS product where support matters, a premium pick often saves more hours than it costs.
How to Set Up an Analytics Dashboard Template
Most templates on this list follow the same setup pattern.
1.Clone the repo: git clone the template URL.
2. Install dependencies: npm install (or yarn install / pnpm install).
3. Run the dev server: npm run dev, usually on localhost:3000 or :5173.
4. Connect your data: replace the mock chart and table data with real API calls.
5. Customize theming: update the theme config or SCSS variables for brand colors, fonts, and logo.
6. Build for production: npm run build to generate deployable files.
For static HTML templates, open index.html and edit the markup directly.
Common Mistakes to Avoid With Analytics Templates
• Picking for charts alone. Check the data table and state handling too, since those carry most analytics screens.
• Ignoring the chart license. Some chart libraries are free for open-source but paid for commercial use. Verify before shipping.
• Skipping the last commit date. Templates left for two years or more often carry security issues.
• Forcing a framework mismatch. Adapting a React analytics template for a Blade app is more work than starting from Bootstrap.
• Loading every chart on one screen. Too many live charts hurt performance. Lazy-load secondary views.
• Shipping without customization. If the dashboard looks like the demo, it costs you brand trust. Spend a day on color, type, and logo.
Start Building Your Analytics Dashboard Faster
The right analytics admin template turns weeks of dashboard setup into a day of configuration. Start with charts, KPI cards, and data tables already built, connect your backend, and ship the reporting your product needs.
Browse the full admin templates collection at MyCreativeTemplates to find the analytics dashboard that fits your stack, or start with the free admin templates if you are building an MVP.
Also Know –
- 10 Best CRM Dashboard Templates
- Best Next.js Admin Templates for SaaS Projects
- Best Ecommerce Admin Dashboard Templates
Frequently Asked Questions
1. What is an analytics admin template?
An analytics admin template is a pre-built admin dashboard focused on data display. It includes charts, KPI widgets, data tables, and reporting layouts, so developers can track metrics without building the interface from scratch. You connect a data source and customise the views to fit your product.
2. Are analytics dashboard templates free?
Many are. AdminLTE, Tabler, Gentelella, Shadcn Admin, and Vuestic Admin are free and MIT-licensed for commercial use. Others, such as Metronic and the pro tiers of TailAdmin and Materio, are premium with more pages and support. Free options suit most MVPs and internal tools.
3. Which is the best analytics dashboard template in 2026?
It depends on your stack. TailAdmin is the strongest multi-framework pick, Gentelella offers the widest chart range, Tabler leads free Bootstrap design, and Metronic is the top premium choice. For React, Mantis and Berry are reliable starting points for analytics dashboards.
4. Can I use these templates for web analytics?
Yes. Most analytics admin templates include traffic, conversion, and visitor widgets you can wire into a web analytics dashboard template setup. Connect your data source, such as a REST API or your analytics backend, and map the metrics to the prebuilt charts and tables.
5. Do analytics admin templates support real-time data?
The templates provide the UI, not the data feed. You add real-time updates by connecting WebSockets or polling to the chart and table components. Templates using ApexCharts, ECharts, or Recharts handle frequent data changes well, which makes them suitable for live dashboard analytics.